January 2026
LiveSpecusol — Solar Energy Market Dashboard
Modeling surplus Texas solar energy as a tradeable asset — built in 36 hours.
EnergyHack @ Georgia Tech · my first hackathon · team of 2 · built in 36 hours
// overview
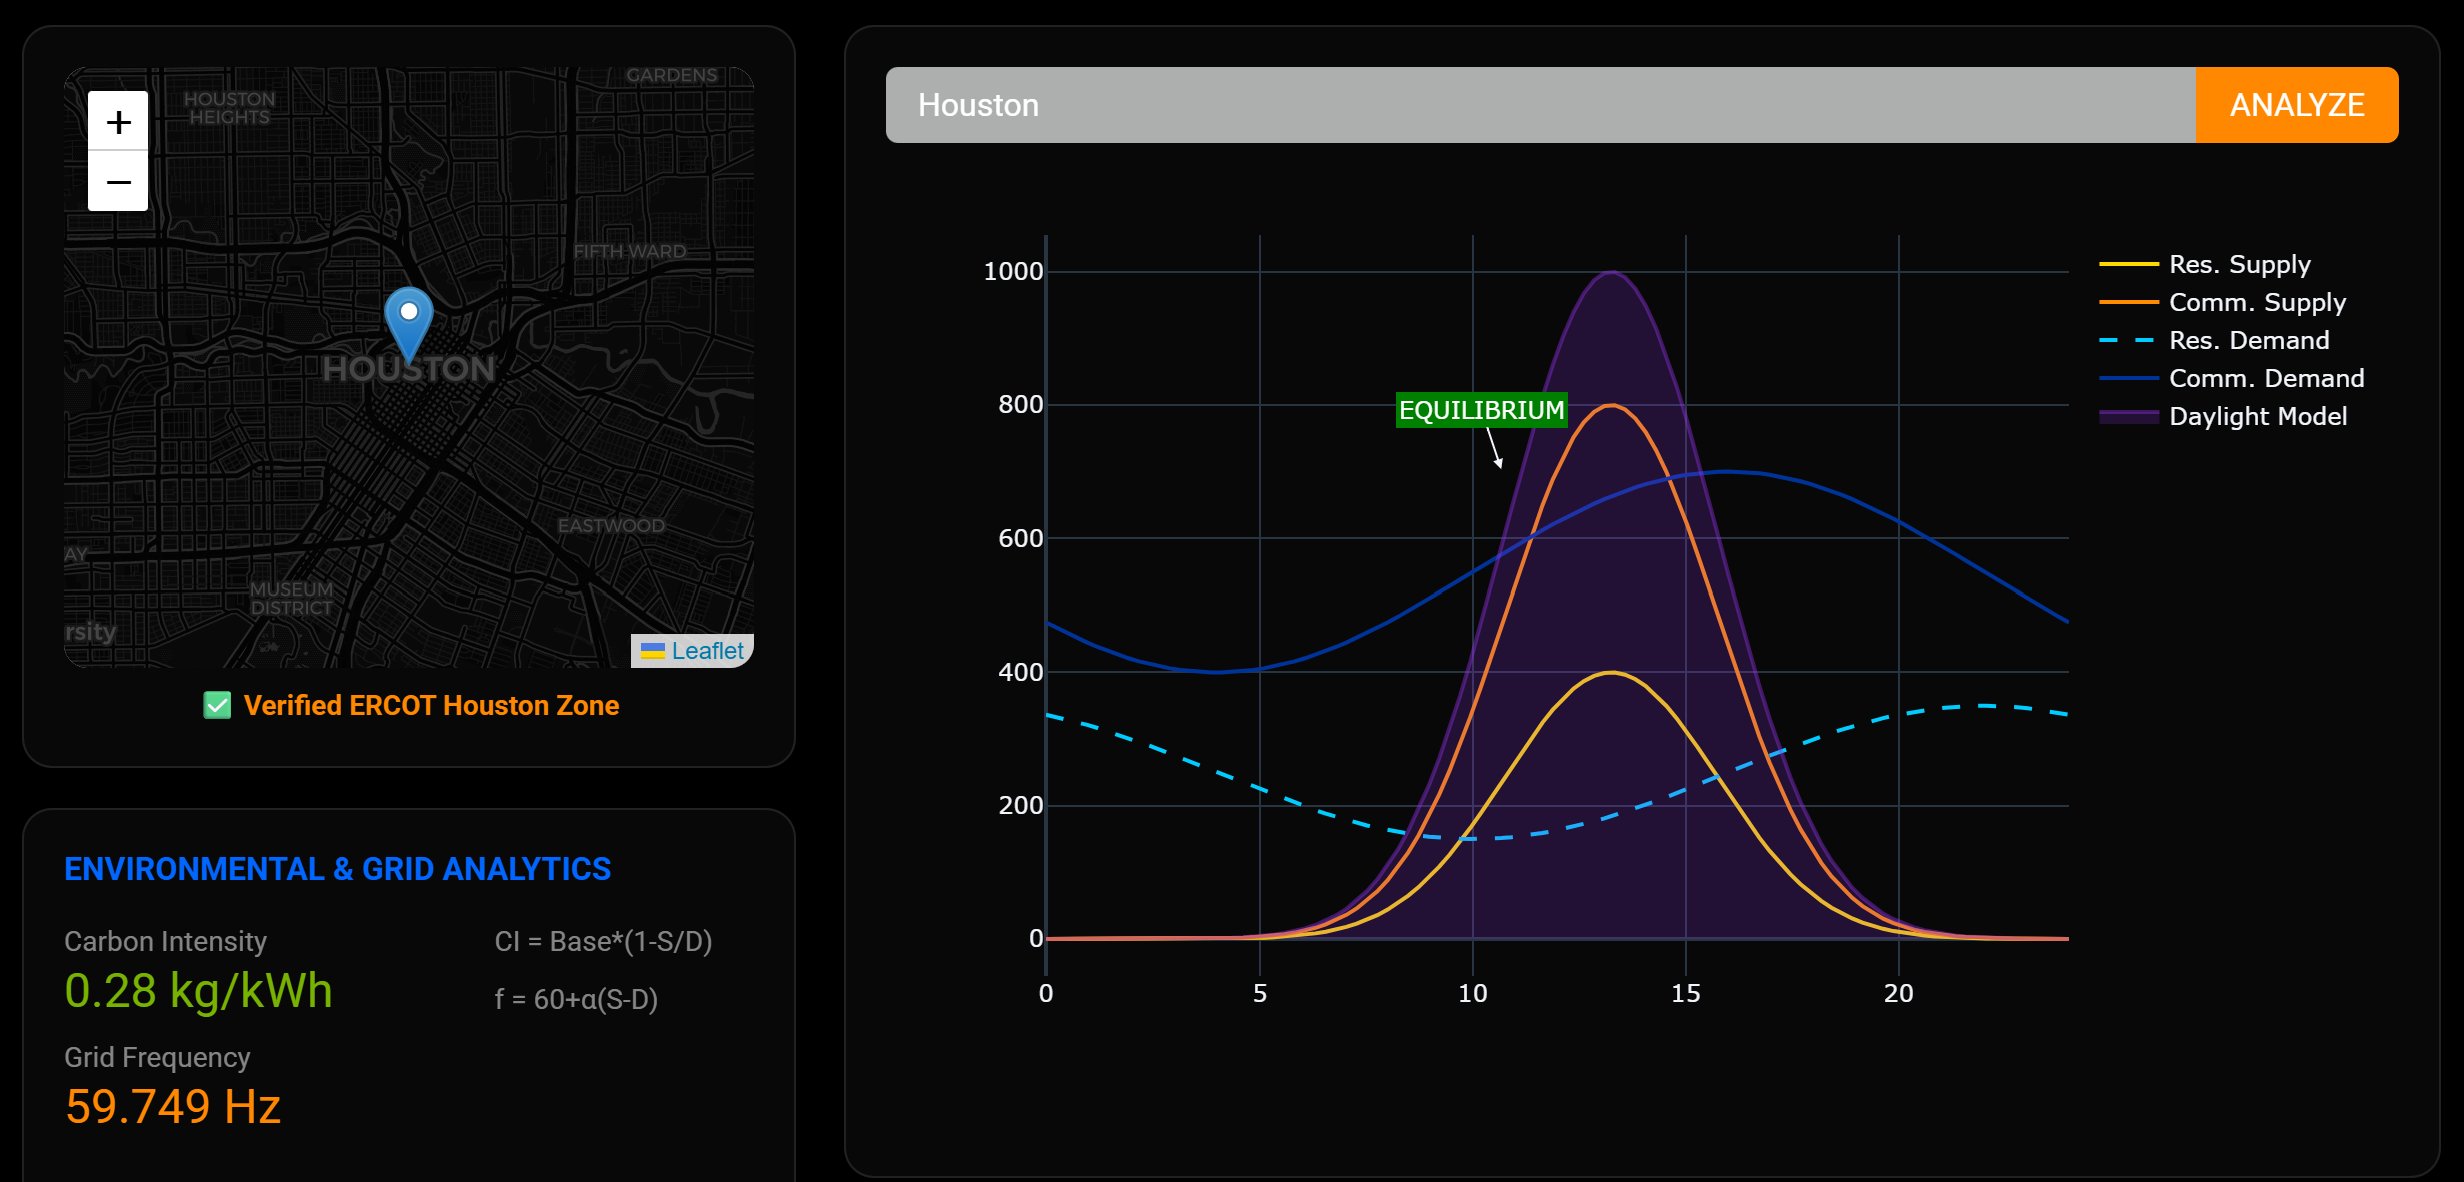
EnergyHack challenged teams to turn an energy problem into something tangible in 36 hours. We built Specusol, a dashboard that models surplus solar energy in Texas's ERCOT grid as if it were a tradeable financial asset — pairing real grid zones with supply, demand, and solar-generation data so the surplus is easy to see and reason about. It was my first hackathon, my first time using Git and deploying to the web, and we shipped it live on Render by the deadline.
// what I built
- Designed and implemented the ERCOT zone map — my idea and my first build of it — using a pure-Python address-to-zone lookup so any Texas location maps to the right grid zone.
- Built the supply-and-demand and solar-irradiance / daylight visualizations, including automatic detection of the supply–demand equilibrium point.
- Integrated my work with my teammate's stock-tracking layer and jointly deployed the final app to Render.
// tech stack
// what I learned
- How to collaborate in Git with a teammate — branching, merging two separate repos, and working through the messiness that comes with it.
- How to take a project all the way to a live, deployed URL, not just something that runs on my own laptop.
- How to scope tightly and make decisions quickly when the clock is the hardest constraint.